For software whose value fits on one screen
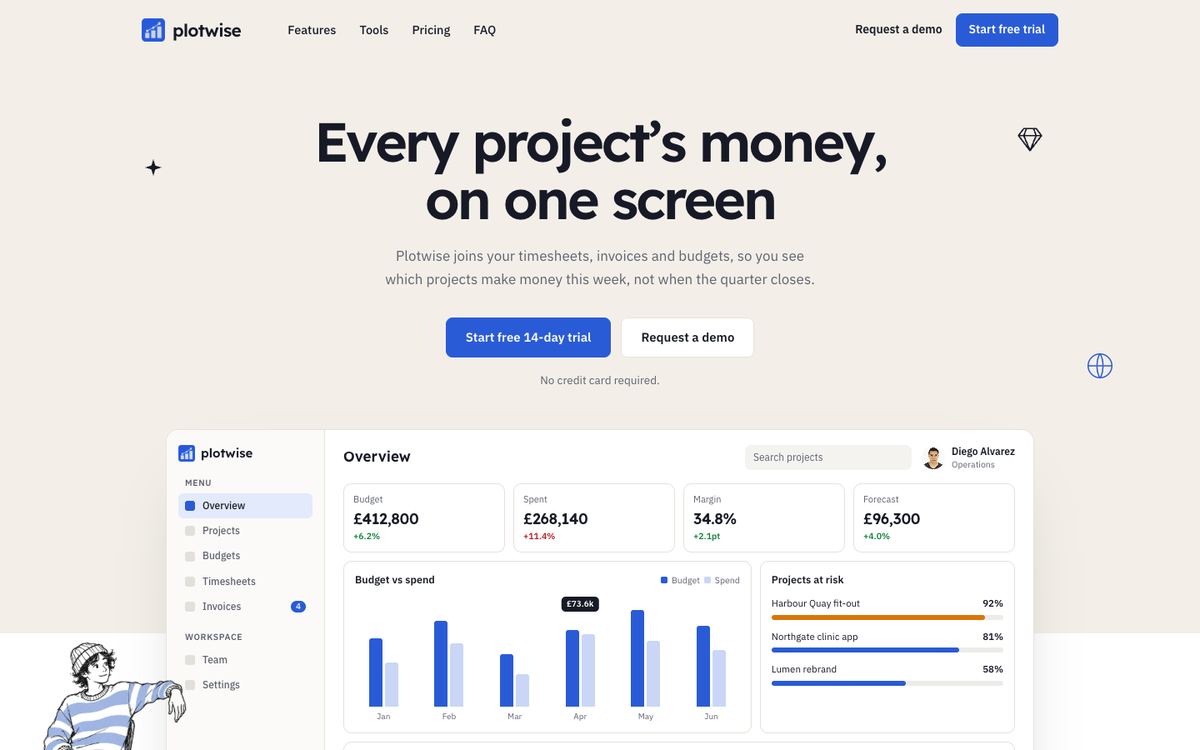
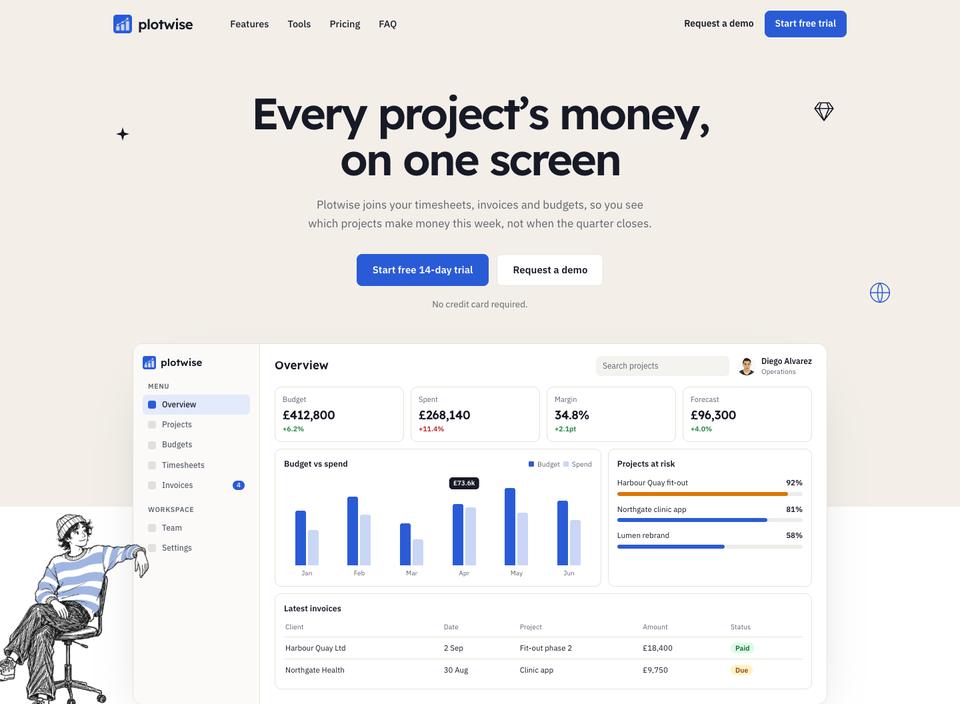
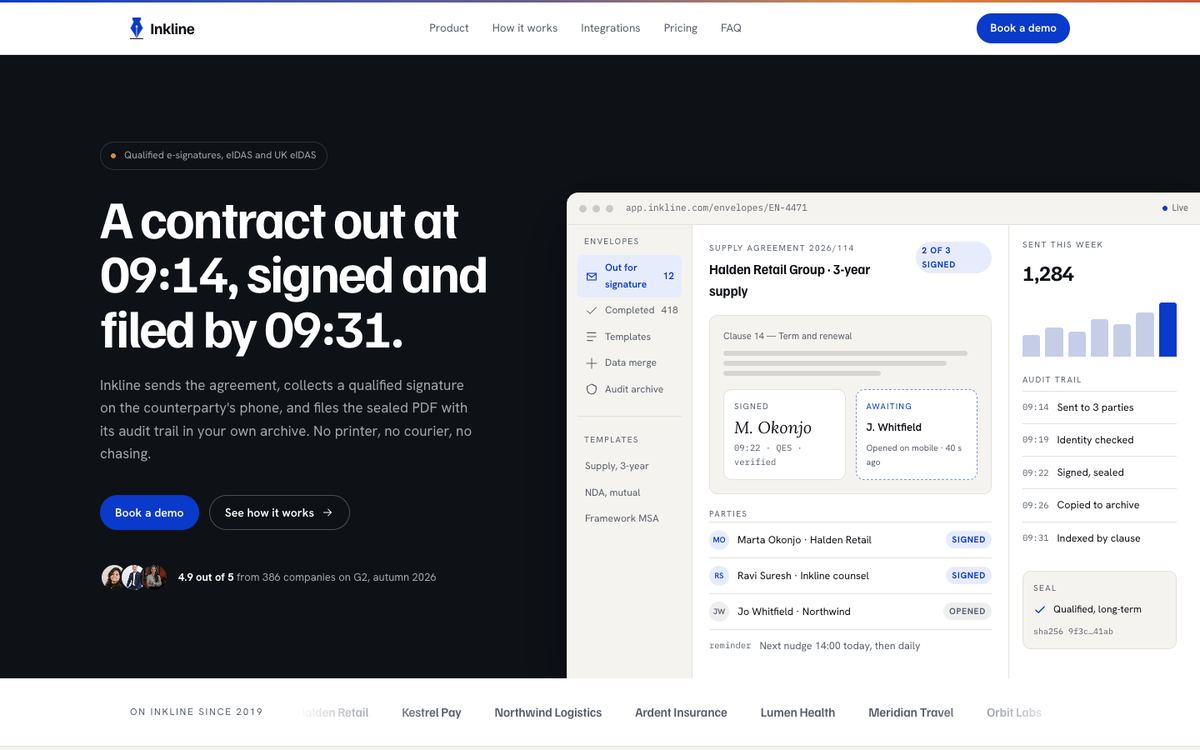
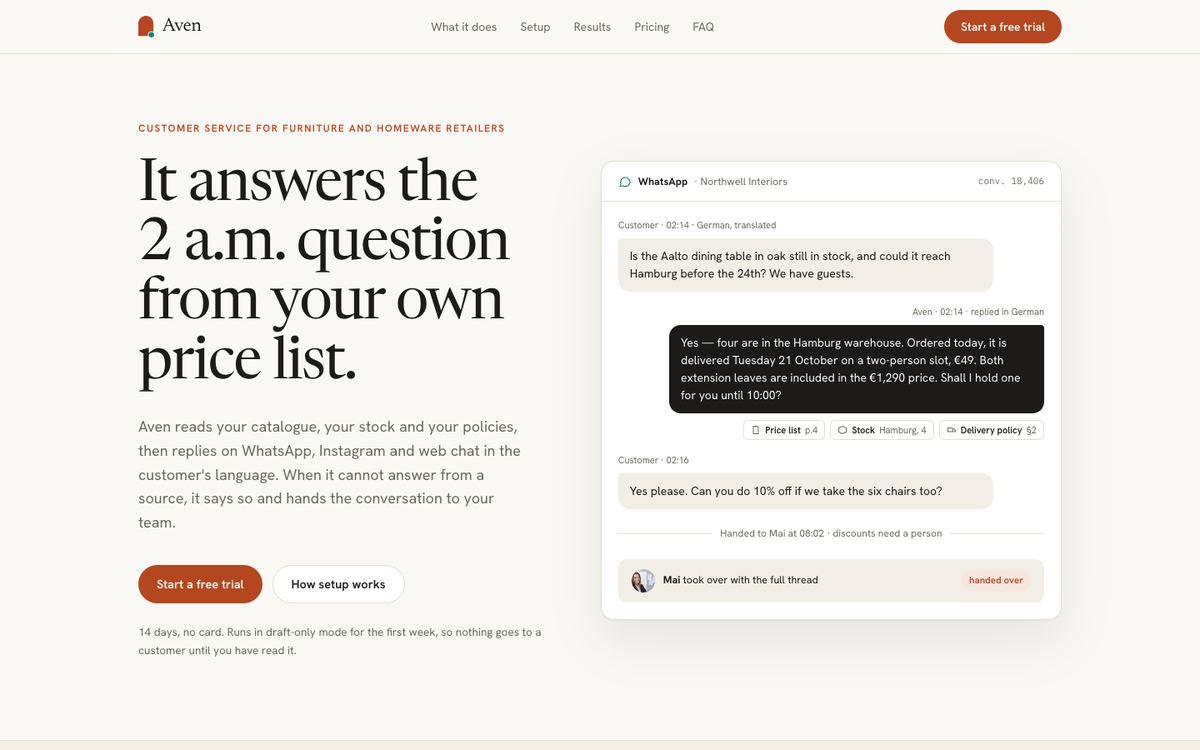
Some products are easiest to sell by showing the one view a customer will open every morning. Project Finance Dashboard is built around that view: a centred hero over a large dashboard drawn in HTML. Numbered feature rows with quotes, a dark band of tools, one customer story and a trial form follow.
It suits project budgeting and profitability software, resource planning, timesheets and invoicing, and operations dashboards sold on a free trial to operations, finance or project leads. Choose it when the screen itself is the best argument.
How the page gets a trial started
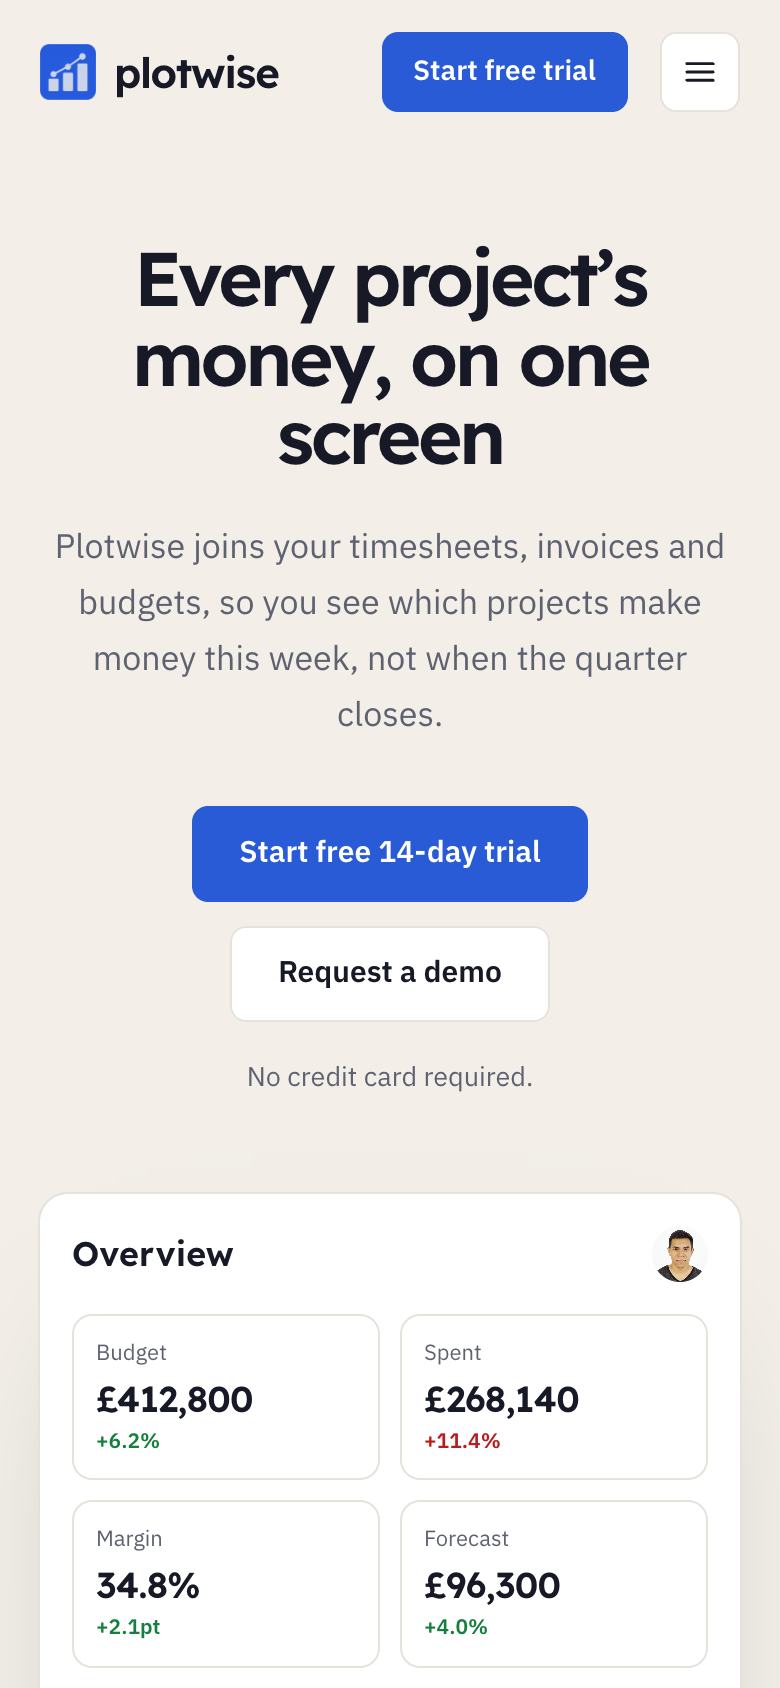
The hero makes the promise in a few words, “Every project’s money, on one screen”, explains which data sources the product joins, and shows the dashboard large beneath it. A ratings strip gives the review score and where it comes from.
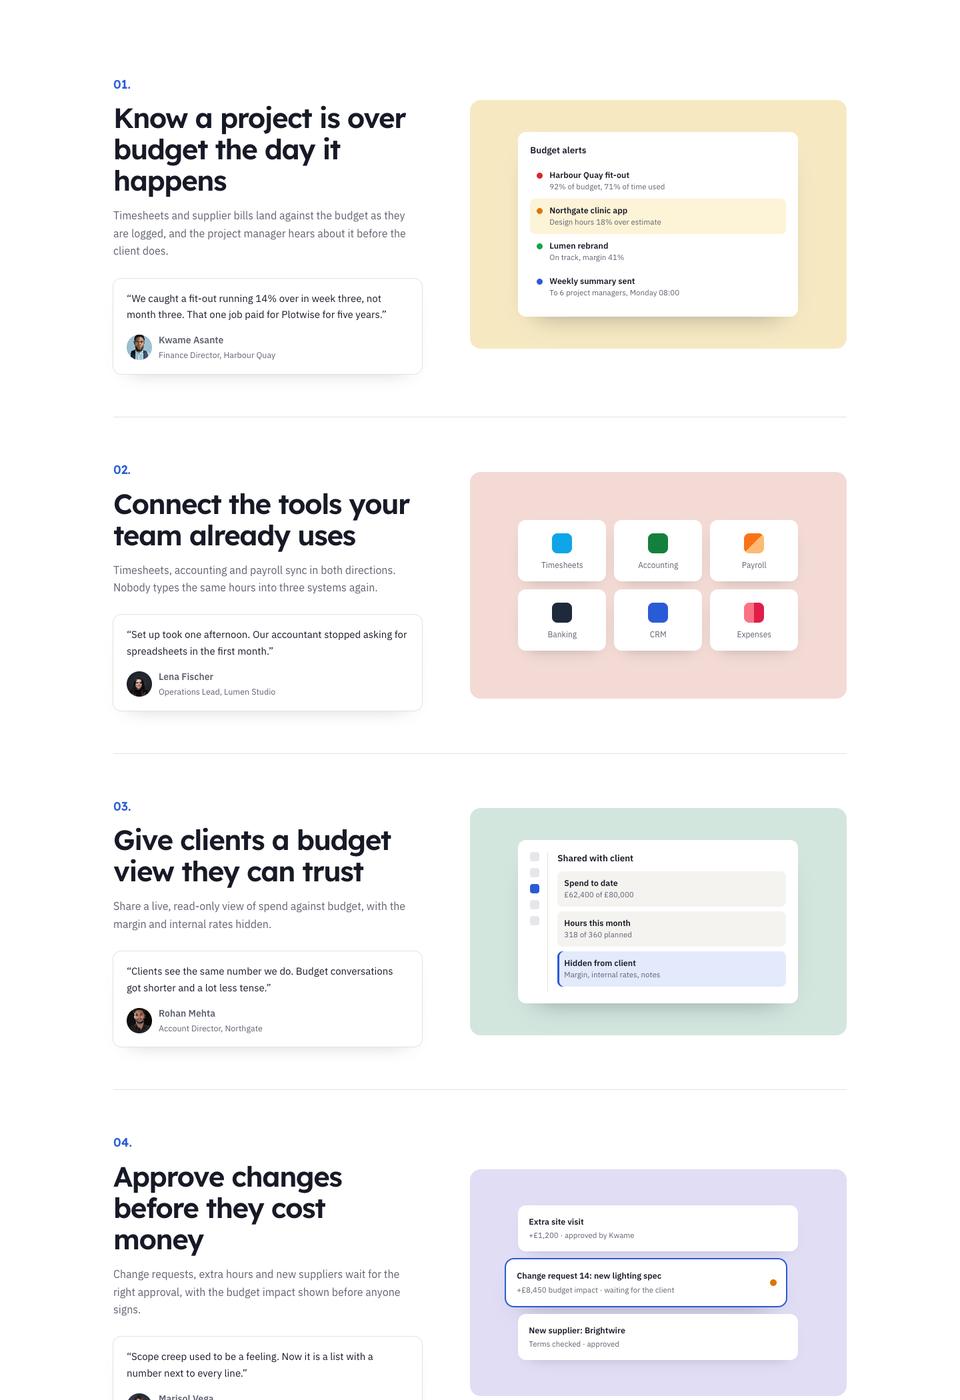
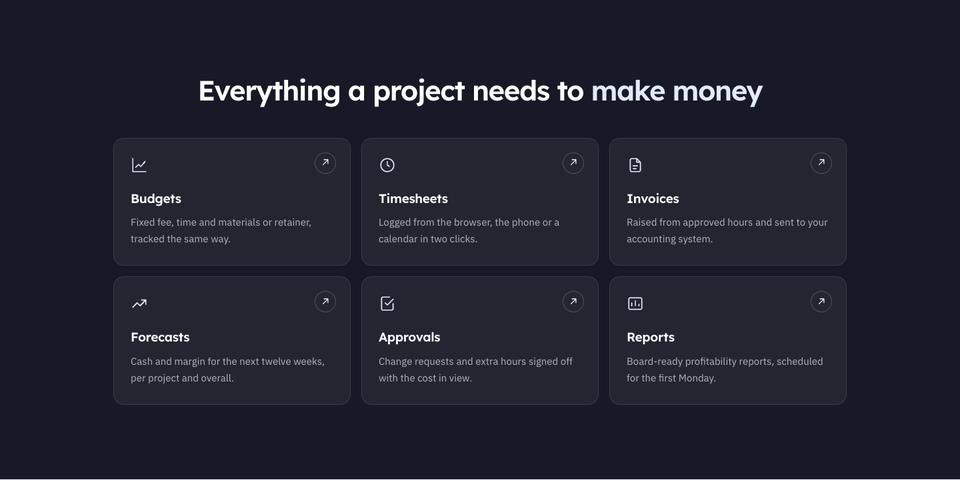
Features is a set of numbered rows. Each states an outcome, such as knowing a project is over budget the day it happens, shows the relevant panel and adds a customer line. Tools is a dark band listing everything the product covers, from budgets to invoicing.
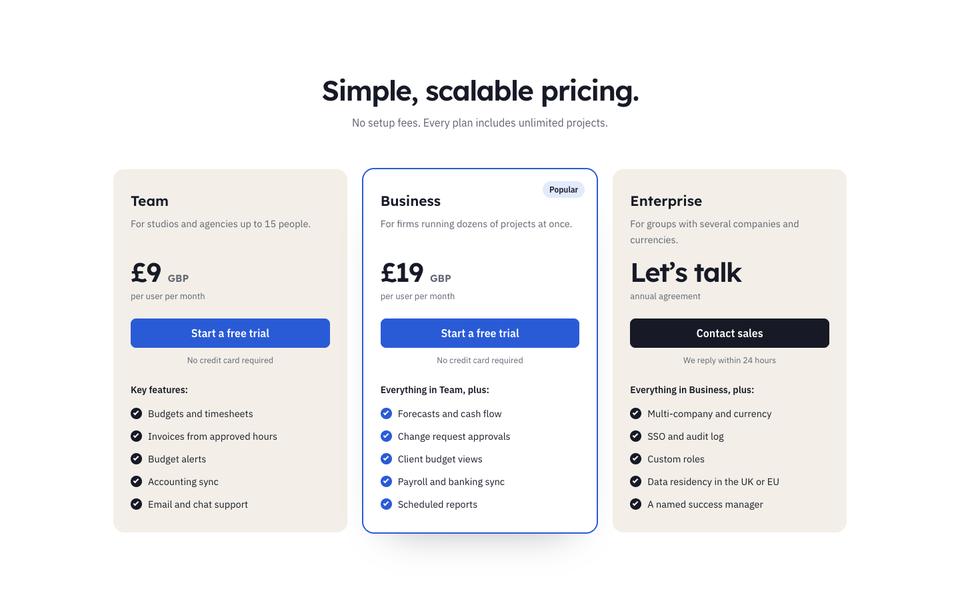
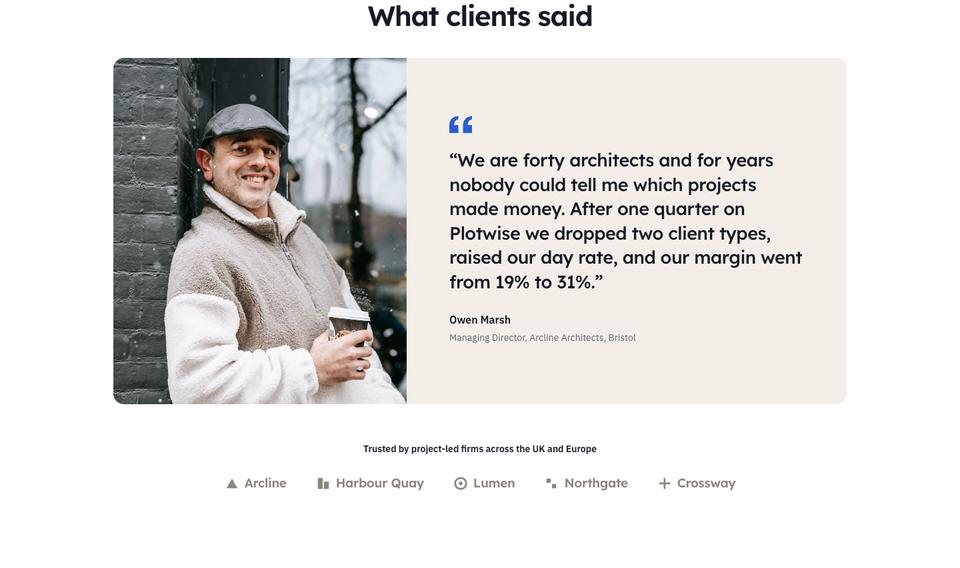
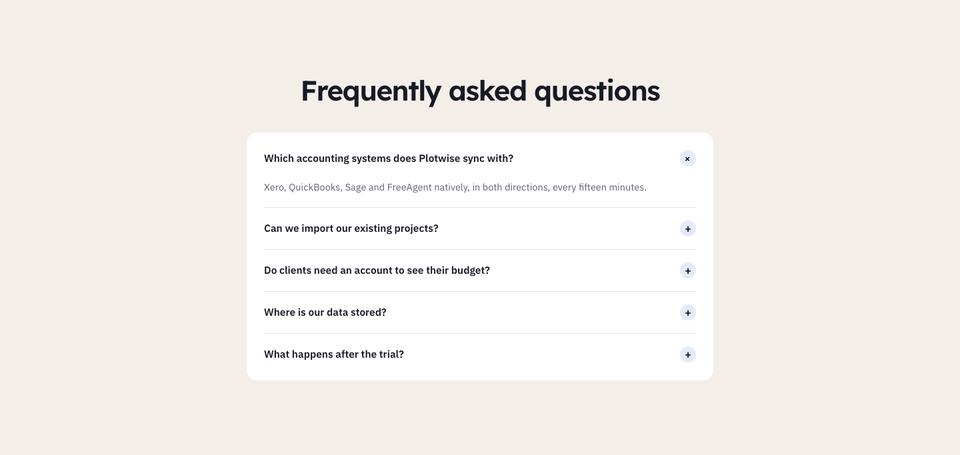
Pricing shows plans with no setup fees. Client story tells one customer’s change in a few sentences, questions covers accounting integrations and migration, and start invites the visitor to see their own margins this week with a short trial form.
The balance between one large visual and short, numbered explanations suits buyers who want to understand a product quickly. It is especially effective for finance-minded readers, who trust a screen full of plausible numbers more than any claim.
Adjusting the look
Four schemes are included: Royal blue, Deep teal, Ember and Graphite. Headings can be Lexend, Familjen Grotesk or Manrope. Six images are used alongside the drawn panels; customer photos and logos help most.
The drawn dashboard, feature rows and plans are editable. Select a feature row and ask the AI to rewrite it for your product.
Writing it for your product
You can start from the template for free, or tick “Write the text for my business” so the AI writes your copy for about 20 credits, keeping the layout. Include what the main screen shows, data sources and integrations, key outcomes, tools covered, pricing, a customer story and trial terms.
Building a dashboard people believe
The large dashboard in this template is drawn in HTML, which means its numbers and labels are yours to set, and buyers will read them closely. Build it around one realistic company, with project names, budgets, hours logged and invoiced amounts that add up. Show one project over budget and one healthy, since a perfect dashboard looks invented and hides the problem your product solves.
The numbered feature rows each pair a capability with a customer quote, so collect quotes that mention the specific moment the feature helped, for example spotting an overrun on the day it happened. The tools band needs the modules a customer gets, such as budgets, timesheets, invoicing and forecasting, with a line on what each does. Review scores in the trust strip must come from named directories with the number of reviews.
The customer story should describe one company with its size, the problem before, how quickly they started and a financial result. For pricing, list per-user prices for each plan, what the trial includes, whether a card is required, and the integrations with accounting and payroll systems in each tier. Six photographs are used, including the customer story, so ask that customer for a team photo in their own office.
Explain how data gets in on day one, whether by importing timesheets, connecting accounting software or entering budgets manually. Operations and finance leads worry about setup time more than features.
Resource planning, forecasting and asset trackers
A resource planning tool can draw a team calendar with capacity and allocations. Cash-flow forecasting products usually show a thirteen-week forecast with scenarios. Reporting and BI dashboards can centre the hero on a chart built from connected sources. Asset and fleet trackers can replace projects with vehicles or equipment, showing locations, utilisation and maintenance due.
When another template fits better
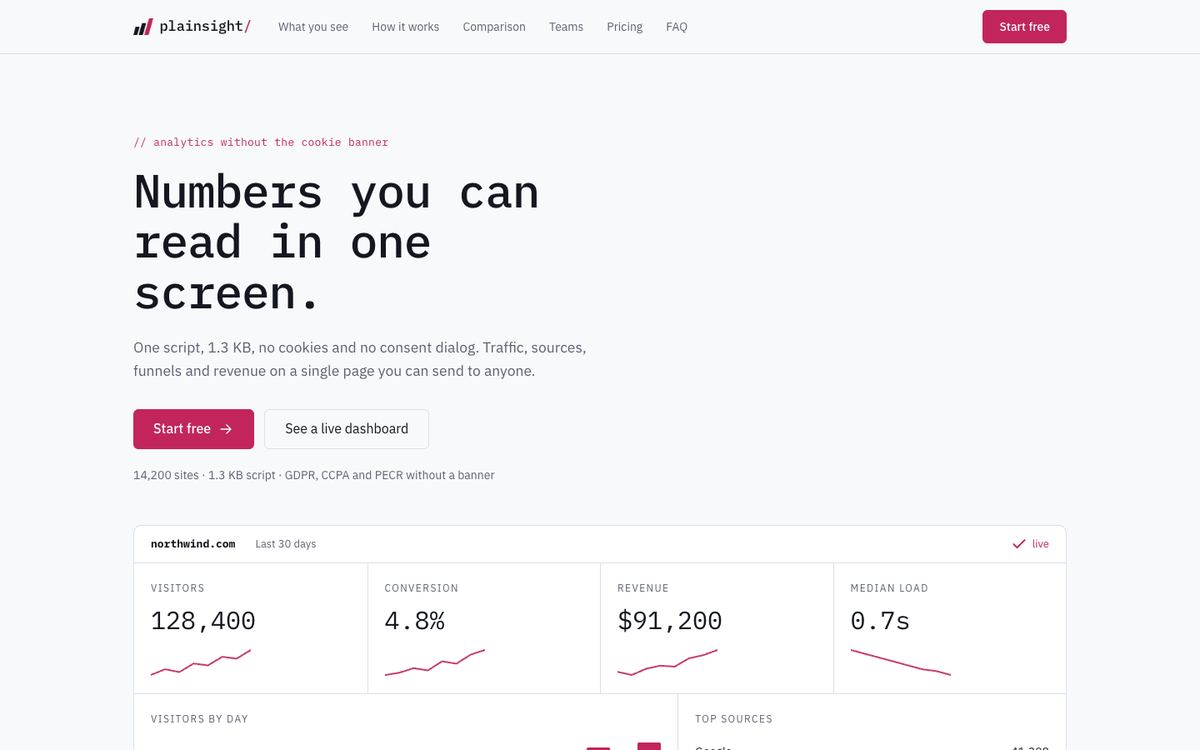
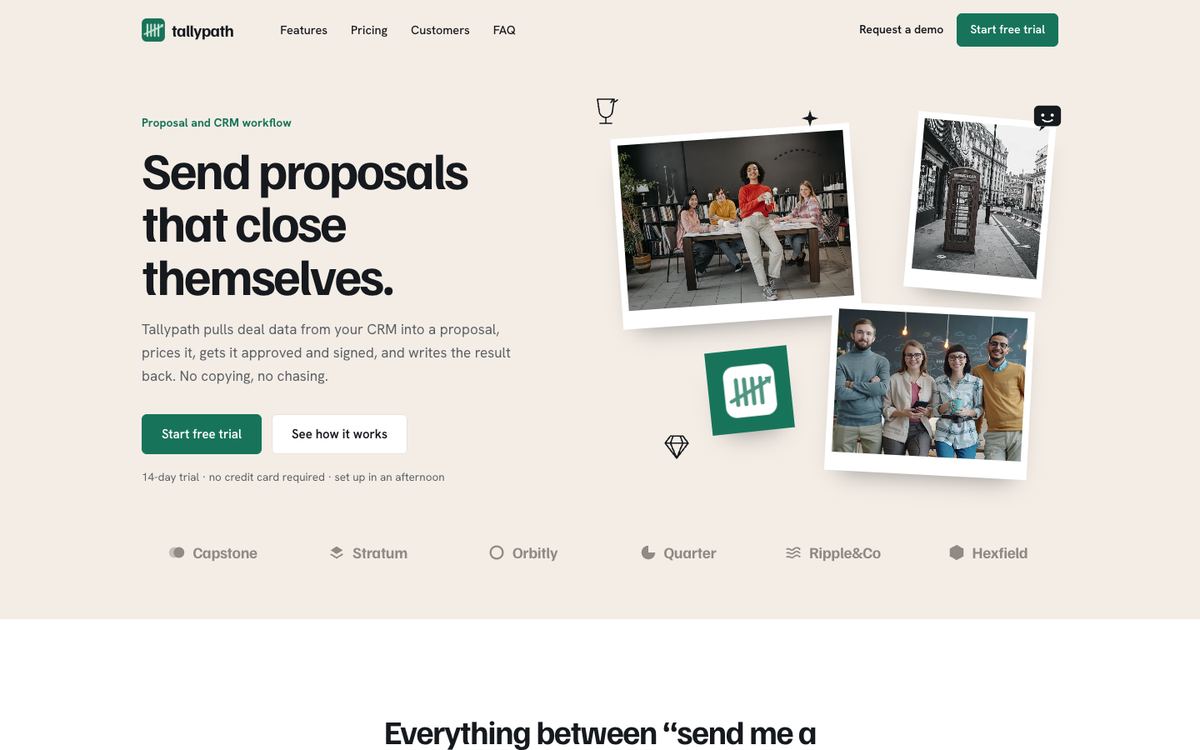
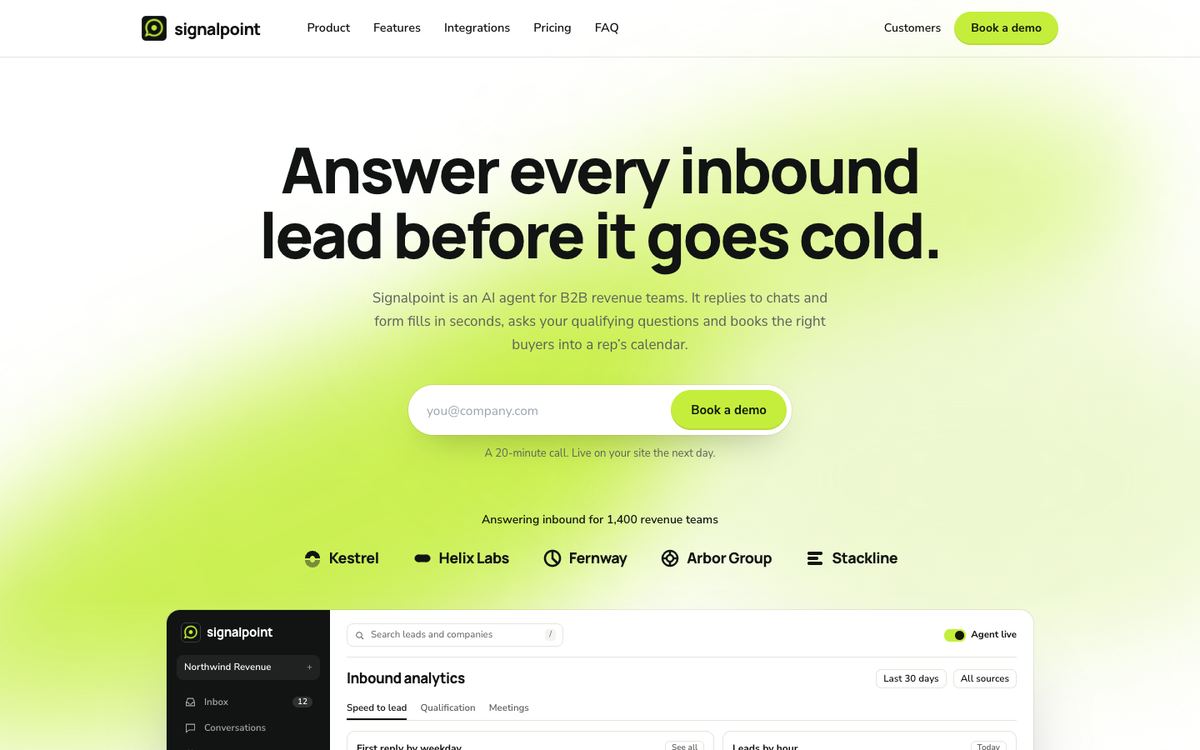
Project Finance Dashboard is friendly and visual. Analytics products for technical buyers fit Data Panel, and spend management for finance teams belongs on Lime Ledger. Proposal and workflow tools suit Warm B2B Workflow, and field-service software Trade Operations Suite.
See every software layout on the SaaS and software templates page.
Before you publish
- Replace the drawn dashboard with your product's real view.
- Check review scores and where they come from.
- Confirm integrations and plan prices.
- Connect the trial form to your sign-up.